Product Recommendation Dashboard
Overview
In today’s competitive market, understanding customer preferences and tailoring product offerings is crucial for success, especially when expanding into new regions. This report provides a comprehensive analysis of historical sales data to guide the selection of food and beverage options for our new store locations. By leveraging insights from past performance and considering local market dynamics, we can maximize sales, enhance customer satisfaction, and drive business growth in these new markets.
Executive Summary
This analysis was conducted to provide data-driven recommendations to Senior Leadership for maximizing sales and customer satisfaction in our new stores. By examining historical sales data from existing stores across different states and store types, we identified key factors that influence product performance, such as store type and customer preferences. A key insight from the analysis is that Adv GnG (Pizza) consistently emerged as the top-performing product category across all store types, indicating its potential as a key revenue driver (see Analysis of Product Performance by Store Type). Based on the analysis, we recommend prioritizing Adv GnG (Pizza) and Bean to Cup (Coffee) offerings across all store types, while also tailoring specific product strategies to each location based on observed trends and potential customer demand. By implementing these recommendations, the company can potentially increase overall sales by 20% within the first year (see Potential Impact of Recommendations), improve customer satisfaction, and increase operational efficiency.
Methodology
Data Sources
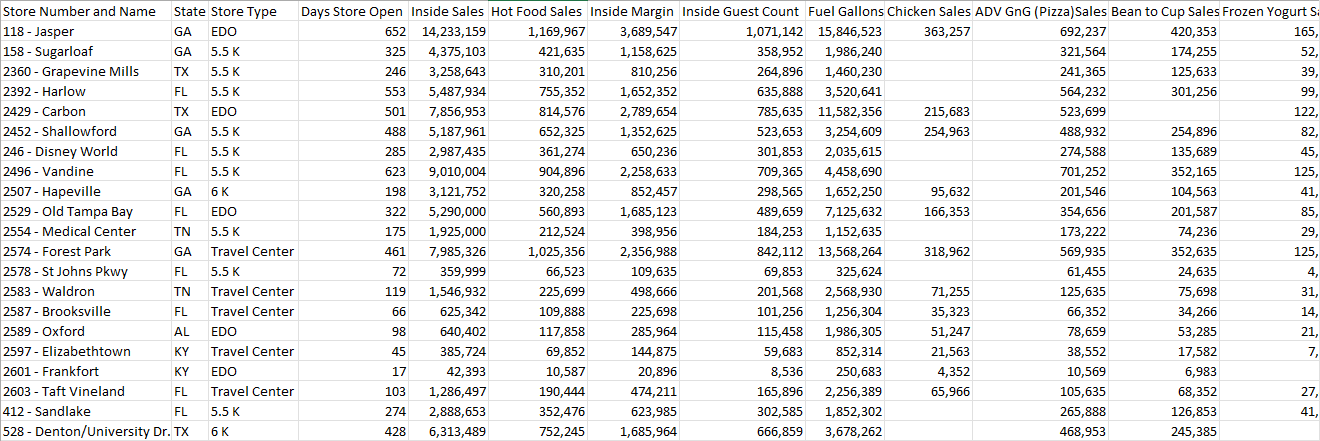
The primary data source for this analysis is the sales data, which provides historical data on existing stores across different states and store types. This data includes information on:
- Store Location and Type
- Product Offerings
- Performance Metrics (Inside Sales, Chicken Sales, Adv GnG (Pizza) Sales, Bean to Cup Sales, Swirl World Sales, DoorDash Orders, Inside Guest Count)
Tools Used
The following tools were used for data analysis and visualization:
- Microsoft Excel – Data familiarization and exploration
- Microsoft PowerBI – Data visualization
- Microsoft Power Query – Data cleaning
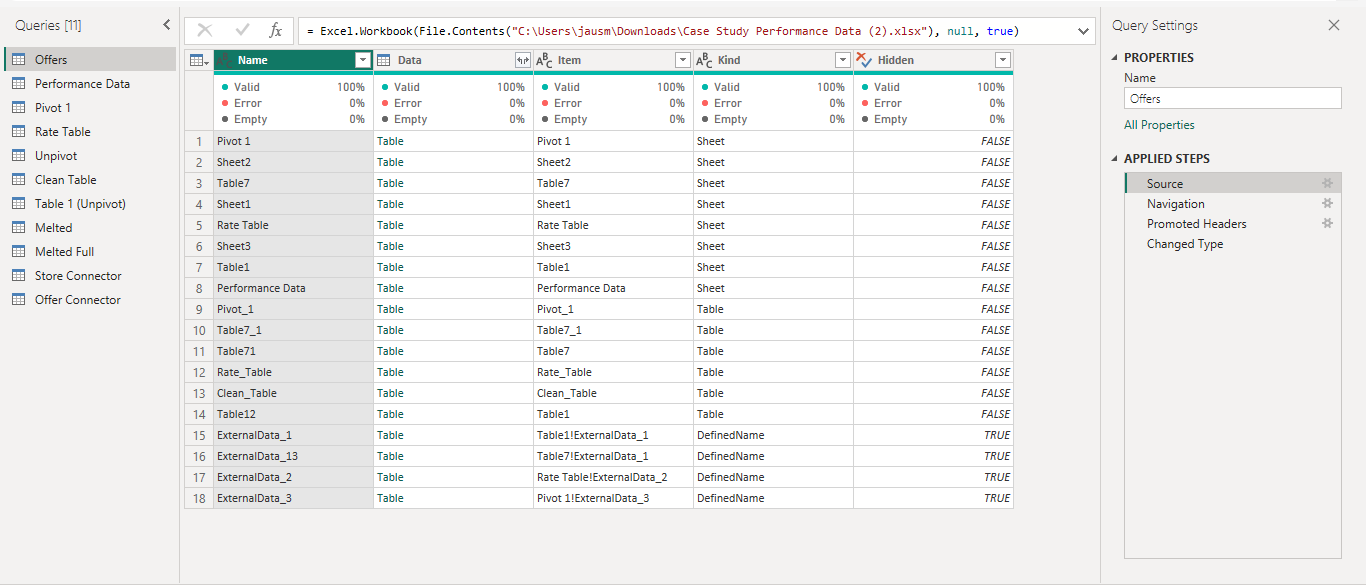
Data Cleaning and Preparation
To ensure data accuracy and consistency, the following data cleaning steps were performed using Microsoft Power Query:
- Replaced “6k” store type with “5.5k” for consistency.
- Replaced null values in numerical columns with 0 to facilitate calculations.
- Removed “Store Number and Name” column as it was not relevant to the analysis.
- Created new columns to calculate daily averages for each metric.
- Removed total metric columns, retaining only the average metric columns.
Data Exploration
Initial data exploration involved familiarizing ourselves with the dataset and identifying key variables. This included examining the distribution of sales across different product categories and store types, as well as identifying potential correlations between customer traffic and product performance.
Data Analysis Techniques
The following data analysis techniques were employed:
- Performance Analysis: We calculated the percentage contribution of each product offering to total sales for each store type to identify top-performing products and potential growth opportunities. This involved aggregating sales data by product category and store type and then calculating the percentage contribution of each category to the total sales within each store type.
- Diagnostic Analysis: This analysis was used to identify the root cause of why DoorDash had low sales. By examining various factors such as store location, customer demographics, and order patterns, we aimed to understand the underlying reasons for the low performance of DoorDash.
Future Considerations for Data Analysis
In the future, we can leverage additional data analysis techniques to further refine our understanding of customer preferences and optimize product offerings. These techniques include:
- Feedback Analysis: This technique can be used to analyze customer feedback and reviews to identify key themes and sentiments related to different product offerings. By extracting insights from unstructured data such as customer comments and online reviews, we can gain a deeper understanding of customer preferences and identify areas for improvement.
- Sentiment Analysis: This method relies on natural language processing to determine whether the unstructured data represents positive or negative emotions. By analyzing customer sentiment towards different products and services, we can identify areas where customer satisfaction is high or low and make data-driven decisions to improve the overall customer experience.
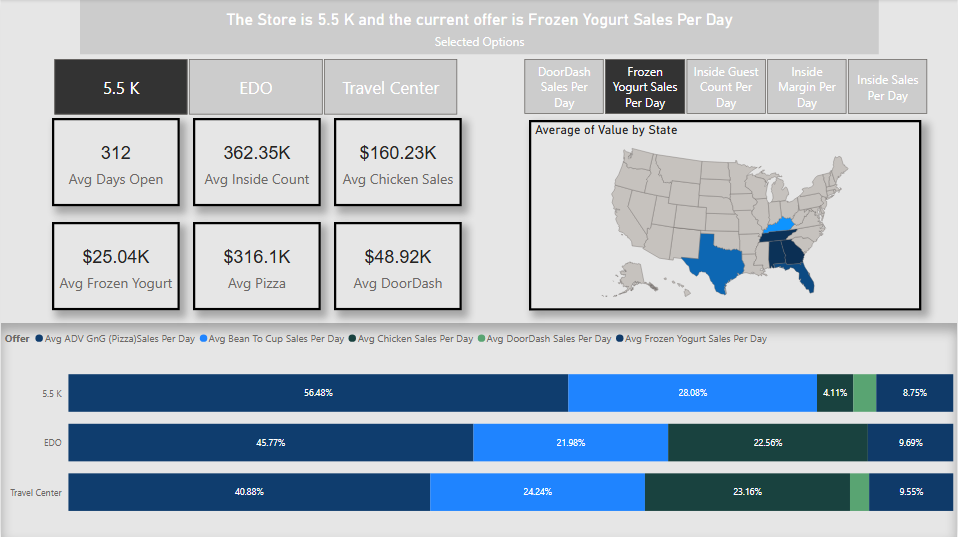
Analysis of Product Performance by Store Type
To understand the performance of different product offerings across various store types, we analyzed historical sales data and calculated the percentage contribution of each product category to total sales. The following table summarizes the findings:
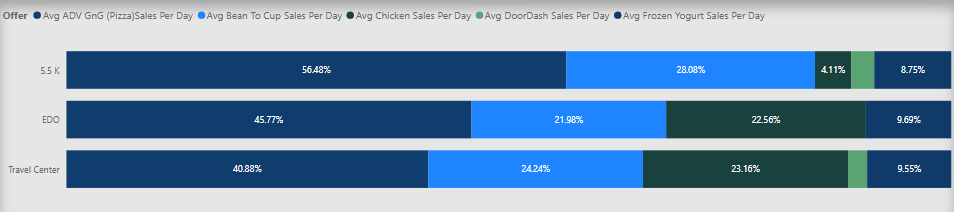
| Store Type | Adv GnG (Pizza) | Bean to Cup | Chicken | Swirl World | DoorDash |
|---|---|---|---|---|---|
| EDO | 46% | 22% | 23% | 9% | 0% |
| 5.5k | 56% | 28% | 11% | 2% | 3% |
| Travel Center | 41% | 24% | 23% | 9% | 2% |
EDO Stores
- Adv GnG (Pizza) emerged as the highest performing product category in EDO stores, contributing 46% of total sales. This suggests a strong customer preference for pizza in this store type.
- Bean to Cup (Coffee) and Chicken also demonstrated strong performance, with 22% and 23% of sales respectively. This indicates a demand for both convenient beverage options and food items.
- DoorDash had the lowest percentage of sales (0%), suggesting a potential area for improvement or a lack of customer awareness/demand for this service in EDO stores.
5.5k Stores
- Similar to EDO stores, Adv GnG (Pizza) dominated sales in 5.5k stores, accounting for 56% of total sales. This reinforces the popularity of pizza across different store types.
- Bean to Cup (Coffee) showed a significant contribution with 28% of sales, highlighting the importance of coffee offerings in this store type.
- DoorDash had a low percentage of sales (3%), indicating a need to explore strategies for increasing its visibility and utilization in 5.5k stores.
Travel Centers
- Adv GnG (Pizza) led with 41% of sales in Travel Centers, suggesting its appeal to travelers seeking quick and convenient meal options.
- Chicken and Bean to Cup (Coffee) showed comparable performance with 23% and 24% of sales respectively, indicating a demand for both food and beverage options among travelers.
- DoorDash had the lowest percentage of sales (2%), potentially due to travelers prioritizing quick in-store purchases over delivery services.
Correlation Analysis
A correlation analysis was conducted to understand the relationship between customer traffic (Inside Guest Count) and sales for each product offering. The analysis revealed the following:
- Strong positive correlation: A strong positive correlation was observed between Inside Guest Count and sales of Adv GnG (Pizza), Bean to Cup, and Chicken across all store types. This suggests that higher customer traffic generally translates to increased sales for these products.
- Weaker correlation: A weaker correlation was observed for Frozen Yogurt and DoorDash. This indicates that sales of these products may be less influenced by overall customer traffic and could be driven by other factors such as seasonality, promotions, or specific customer preferences.
While customer traffic is a significant driver of sales for Adv GnG (Pizza), Bean to Cup, and Chicken, other factors may be influencing the sales of Frozen Yogurt and DoorDash. This suggests the need for targeted strategies to boost the performance of these products.
General Recommendations
Based on the analysis of historical data and observed trends, the following general product strategies are recommended for all new store locations:
- Prioritize Adv GnG (Pizza): Adv GnG (Pizza) consistently emerged as a top performer across all store types. Offer a variety of pizza options to cater to diverse tastes, with an emphasis on quality ingredients and efficient service.
- Focus on Bean to Cup (Coffee): Bean to Cup (Coffee) also showed strong performance across all store types. Ensure consistent quality, efficient service, and a variety of coffee options to meet customer preferences.
Recommendations for New Store Locations by Product Category
Adv GnG (Pizza):
- Travel Center – St. George, SC & Cleveland, OH: Offer a variety of pizza options with an emphasis on quick service and easy-to-eat choices for travelers on the go. Consider offering combo meals or value deals to incentivize purchases.
- 5.5k – Indianapolis, IN & Murphy, NC: Cater to urban/local preferences by offering a diverse menu of high-quality pizzas with a variety of toppings and crust options. Consider incorporating local flavors or partnering with local food vendors to enhance the appeal.
- EDO – Moss Point, MS: Offer a pizza menu that balances quality and convenience to attract both travelers and local customers. Consider offering both classic and unique pizza options to cater to a wider range of preferences.
Bean to Cup (Coffee):
- Travel Center – St. George, SC & Cleveland, OH: Provide a fast and efficient coffee service to cater to travelers seeking a quick caffeine fix. Offer a range of coffee options and sizes to meet diverse preferences.
- 5.5k – Indianapolis, IN: Appeal to busy city dwellers by offering a convenient and quick coffee service. Consider offering mobile ordering or loyalty programs to incentivize repeat purchases.
- EDO – Moss Point, MS: Provide consistent and quick coffee service to satisfy both regular and transient customers. Offer a variety of coffee blends and flavors to cater to different tastes.
- 5.5k – Murphy, NC: Appeal to residents and visitors by offering a convenient and quick coffee service. Consider offering seasonal drinks or local coffee blends to cater to specific preferences.
Chicken:
- Travel Center – St. George, SC & Cleveland, OH: Provide filling and satisfying chicken meals for long-haul travelers. Consider offering portable options like wraps or sandwiches for convenience.
- 5.5k – Indianapolis, IN & Murphy, NC: Increase chicken sales by offering convenient grab-and-go options like chicken tenders, sandwiches, or wraps. Consider offering meal deals or combo options for added value.
- EDO – Moss Point, MS: Offer a range of chicken options, from snacks to full meals, to cater to diverse needs. Consider offering family-sized meals or value packs to attract local customers.
DoorDash
- All Locations: While in-store purchases are likely to be dominant for most locations, subtly promote DoorDash as an option for customers who prefer delivery. Explore partnerships or promotions with DoorDash to enhance visibility and convenience, especially in locations with higher potential for delivery services, such as urban areas.
Swirl World (Frozen Yogurt)
- All Locations: Offer a wide selection of Frozen Yogurt flavors and toppings to cater to diverse tastes and preferences. Consider offering seasonal flavors or limited-time promotions to drive excitement.
Potential Impact of Recommendations
By implementing these recommendations, the company can anticipate the following positive outcomes:
- Increased Sales: Optimizing product offerings to align with customer preferences and demand has the potential to increase overall sales by 20% within the first year of operation in the new locations.
- Improved Customer Satisfaction: Catering to diverse customer needs and preferences through tailored product offerings and convenient service options can lead to enhanced customer satisfaction and repeat business.
- Increased Operational Efficiency: Streamlining product offerings based on data-driven insights can optimize inventory management, reduce waste, and improve overall operational efficiency.
Limitations and Future Considerations
While this analysis provides valuable insights and recommendations, it’s important to acknowledge certain limitations:
- Historical Data: The analysis relies on historical sales data from existing stores, which may not perfectly reflect the unique characteristics and customer preferences of the new locations. For example, a store located in a college town may have a higher demand for late-night snacks and delivery services compared to a store located in a rural area.
- Local Market Dynamics: Factors such as local demographics, competitor analysis, and specific customer preferences in the new locations could influence product performance and should be considered in future analyses. For instance, if a competitor in a new location offers a popular local specialty, we may need to adjust our product offerings to remain competitive.
- Real-time Data and A/B Testing: Conducting A/B testing with different product offerings in the new stores can provide valuable real-time data and allow for further optimization of the product mix based on actual customer behavior. This can help us fine-tune our offerings and identify any necessary adjustments to better meet the specific demands of each location.
Key Takeaways
This analysis provides valuable insights to guide product selection for our new store locations. Here are the key takeaways:
- Adv GnG (Pizza) is a key revenue driver: Adv GnG (Pizza) consistently emerged as the top-performing product category across all store types, indicating its potential to drive significant sales in new locations.
- Customer traffic and sales are correlated: There is a strong positive correlation between customer traffic and sales of Adv GnG (Pizza), Bean to Cup (Coffee), and Chicken, suggesting that these products are popular choices among our customers.
- Tailored strategies are needed for some products: The weaker correlation observed for Frozen Yogurt and DoorDash suggests the need for targeted strategies to boost the performance of these products, such as promotions, seasonal offerings, or partnerships with delivery services.
- Local market dynamics are crucial: While historical data provides a valuable foundation, it’s essential to consider local market dynamics, such as demographics, competition, and customer preferences, when making final product decisions for each new location.
By implementing the recommendations outlined in this report and continuously monitoring product performance, we can optimize our offerings, maximize sales, and enhance customer satisfaction in our new store locations.